

|
|
I was thinking during a car ride, what is the optimal speed to drive at? Optimal here means I want to maximize my expected time not on the road. The gimmick here is that as you drive faster, you reduce your life expectancy.

I want to use American driving survey
- 94.5% of U.S. residents ages 16 years and older drove at least occasionally in 2022, unchanged from 2021 and 2020.
- Drivers made an average of 2.44 driving trips, spending 60.2 minutes behind the wheel, and driving 30.1 miles each day in 2022, all of which represented small but not statistically significant decreases relative to 2021.
- Projecting these results nationwide, drivers made a total of 227 billion driving trips, spent 93 billion hours driving, and drove 2.8 trillion miles in 2022.
The survey breaks down patterns by age. But high-level, there are 94B driving hours per year
From https://www.nhtsa.gov/press-releases/traffic-crash-death-estimates-2022,
The National Highway Traffic Safety Administration has released its latest projections for traffic fatalities in 2022, estimating that 42,795 people died in motor vehicle traffic crashes
Using back-of-envelope from above
+----------------+--------------------+
| 94,000,000,000 | hours              |
|----------------+--------------------|
| 42,795         | fatalities         |
|----------------+--------------------|
| 4.55E-07       | Prob(fatal / hour) |
+----------------+--------------------+
But if we assume that a driver would live 40 years, then a fatality would cost 3.50E+05 hours. Multiplying these together implies that an hour on the road reduces life expectancy by 9.6 minutes!
From WHO:
A 5% reduction in average speed can reduce the number of fatalities by 20% (Fig. 1.2)
We found that the average age of somebody on the road is calculated to be 46 years old. The remaining life expectancy at this age is 33.79.
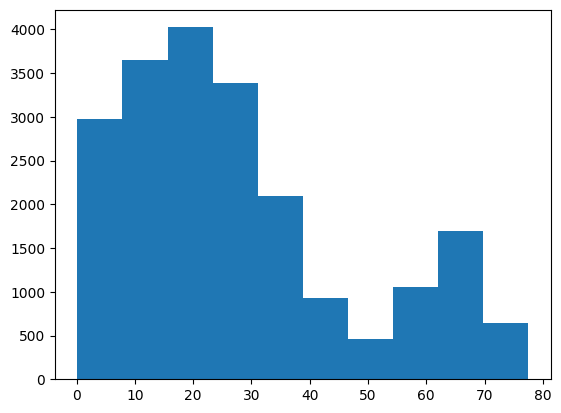
To get fatality rate by mph, this is a little harder, we have to get portion of drive time at each mph. We'll try using this dataset from Kaggle, which gets data from
Low-level parameters acquired by the car via OBD-II and through the micro-devices embedded in the user smartphone, with the goal of accurately characterizing the overall system composed by driver, vehicle and environment
However, it doesn't say how this data was obtained so we don't know if this is biased someway. But the distribution looks believable
Using this data together with the 20% fatality increase per 5% increase (from WHO), extrapolated, we can get relative mortality rate for each speed. Baseline mortality is imputed, so that the overall mortality (freq * mortality) equals the 9.6 minutes calculated above
+----+---------------+-------------+-------------+-----------------------------+
|    | Speed (mph)   |   Frequency |   Mortality |   Life Expectancy Reduction |
|----+---------------+-------------+-------------+-----------------------------|
|  0 | 0-5           |  0.0816922  | 1.15248e-11 |                 0.000204681 |
|  1 | 5-10          |  0.111711   | 6.99139e-10 |                 0.0124167   |
|  2 | 10-15         |  0.108748   | 4.71606e-09 |                 0.0837574   |
|  3 | 15-20         |  0.132361   | 1.6582e-08  |                 0.294498    |
|  4 | 20-25         |  0.113289   | 4.24126e-08 |                 0.753248    |
|  5 | 25-30         |  0.104302   | 8.97763e-08 |                 1.59443     |
|  6 | 30-35         |  0.0773901  | 1.676e-07   |                 2.97657     |
|  7 | 35-40         |  0.0499522  | 2.86095e-07 |                 5.08106     |
|  8 | 40-45         |  0.0310229  | 4.56706e-07 |                 8.11111     |
|  9 | 45-50         |  0.0133843  | 6.92061e-07 |                12.291       |
| 10 | 50-55         |  0.01587    | 1.00593e-06 |                17.8654      |
| 11 | 55-60         |  0.0324092  | 1.41321e-06 |                25.0986      |
| 12 | 60-65         |  0.0457457  | 1.92986e-06 |                34.2744      |
| 13 | 65-70         |  0.0546367  | 2.57292e-06 |                45.695       |
| 14 | 70-75         |  0.0228967  | 3.36044e-06 |                59.6815      |
| 15 | 75-80         |  0.00458891 | 4.3115e-06  |                76.5724      |
+----+---------------+-------------+-------------+-----------------------------+
Finally we can get the graph that we want.
+----+---------------+----------------------+-------------------------+--------------------+
|    | Speed (mph)   |   Time on Road (min) |   LifeE Reduction (min) |   Total Cost (min) |
|----+---------------+----------------------+-------------------------+--------------------|
|  0 | 0-5           |            1440      |              0.00491233 |          1440      |
|  1 | 5-10          |             480      |              0.0993339  |           480.099  |
|  2 | 10-15         |             288      |              0.402035   |           288.402  |
|  3 | 15-20         |             205.714  |              1.00971    |           206.724  |
|  4 | 20-25         |             160      |              2.00866    |           162.009  |
|  5 | 25-30         |             130.909  |              3.47876    |           134.388  |
|  6 | 30-35         |             110.769  |              5.49521    |           116.264  |
|  7 | 35-40         |              96      |              8.12969    |           104.13   |
|  8 | 40-45         |              84.7059 |             11.451      |            96.1569 |
|  9 | 45-50         |              75.7895 |             15.5255     |            91.315  |
| 10 | 50-55         |              68.5714 |             20.4176     |            88.989  |
| 11 | 55-60         |              62.6087 |             26.1899     |            88.7986 |
| 12 | 60-65         |              57.6    |             32.9034     |            90.5034 |
| 13 | 65-70         |              53.3333 |             40.6178     |            93.9512 |
| 14 | 70-75         |              49.6552 |             49.3916     |            99.0467 |
| 15 | 75-80         |              46.4516 |             59.2819     |           105.733  |
+----+---------------+----------------------+-------------------------+--------------------+