

|
|
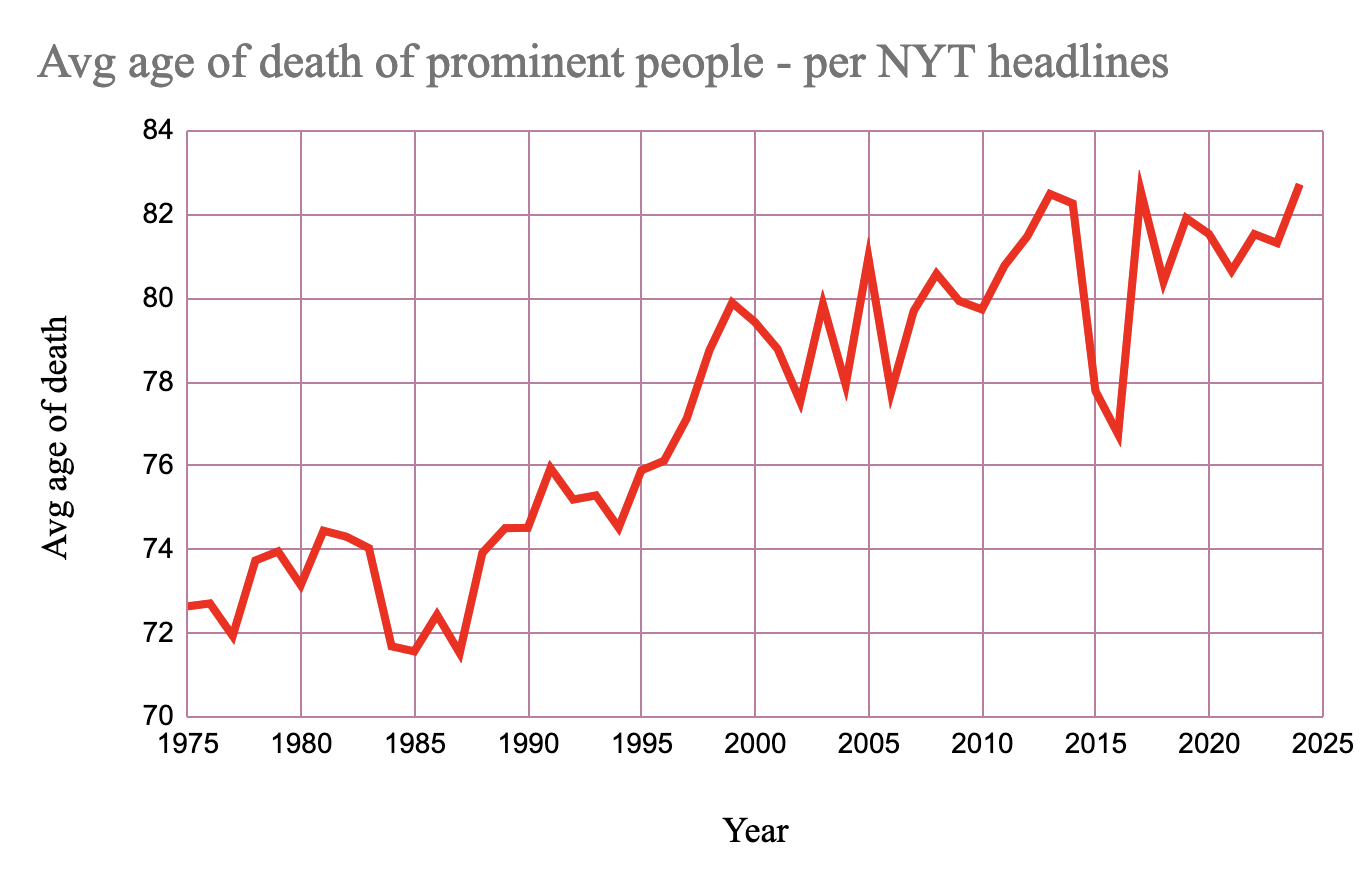
We calculated the average age of death over time of "prominent" individuals. Prominent is defined as NYT had a headline about their death. These are grouped by the year they died.
With ~8k data points, we see a clear upward trend in age at death from ~73 years old to ~82 year old.
We used the NYT API to pull headlines. We then labeled these as describing death, using a combination of heuristics and manual labeling.
Here is the full code we used:
import requests
import retrying
import re
import string

def remove_punctuation(s):
    result = s.replace("-", " ")
    result = ''.join(char for char in result if char not in string.punctuation)
    return result

def has_digit(s):
    s = remove_punctuation(s)
    numbers = list()
    words = s.split()
    for word in words:
        if word.isdigit():
            numbers.append(int(word))
    if len(numbers) == 1:
        return numbers[0]
    return None

@retrying.retry(
    stop_max_attempt_number=3,
    wait_exponential_multiplier=10000,  # 10s, 20s, 40s...
    wait_exponential_max=80000,         # Max wait time is 80s
)
def get_docs(year, month):
    r = requests.get(URL_TEMPLATE.format(year, month, API_KEY))
    response = r.json()

    return response["response"]["docs"]

for year in range(1975, 2025):
    for month in range(1, 13):
        for doc in get_docs(year, month):
            headline = doc["headline"]["main"].lower()
            if headline.find("died") >= 0 or headline.find("dead") >= 0:
                number = has_digit(headline)
                if number and number < 150:
                    # Use equal sign to split columns in spreadsheet
                    print(f"{year}={month}={headline}={number}")
Heuristics used:
~75% of these were manually labeled as positive (representing a death). For manual labeling, most of the time, headlines starting with a name represented a death.
We used the following rules for labeling:
We identify three sources of error:
Firstly, there is editorial decisions in who should be considered prominent. For example, older editors may decide that older figures are deemed prominent. We view this as a source of error, because it doesn't reflect actual changes in prominence. We don't see a clear trend in the volume of prominent deaths reported. It is difficult to estimate the effect of this decision.
Secondly, heuristics are missing some headlines. For example, we accept headlines with "died" but not with "dies." Though this introduces some imprecision, intuitively we do not think this represents any bias.
Thirdly, manual labeling is imprecise. In an attempt to estimate manual labeling error rate, we validated 50 positive and negative labels after the fact, by inspecting these more closely. We found 1 false negative and no false positives. We think this represents a low error rate. However, there could be some bias here for two reasons:
During this same period, life expectancy in the U.S. has increased from ~73 to ~77 years old. Therefore we see that age of death for prominent individuals is increasing faster than overall life expectancy. That said, life expectancy isn't a perfect benchmark, because:
Despite these differences, we still think the difference is meaningful.
It's intuitive that life is increasing more for prominent individuals, since prominence is probably correlated with better access to health care. This is a well-studied phenomenon that economic status correlates with longevity. We think the data here represents cultural status as well, and it would be an interesting follow to analyze if economic status alone can explain the trend we see.